Using Spark to load DynamoDB tables with AWS Spark-Dynamodb connector.
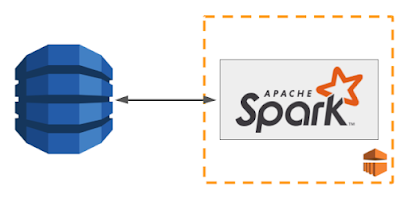
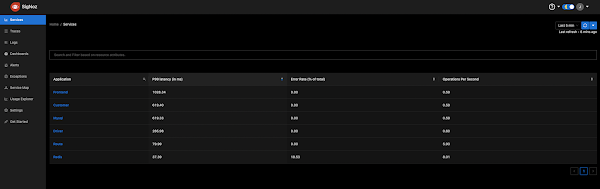
Monitoring DynamoDB Capacity Getting a true picture of DynamoDB WCU/RCU capacity is difficult because the default monitors automatically aggregate WCU/RCU metrics by minute. This hides spikes and abstracts away true metrics of WCU/RCU consumption (Cloudwatch also does the same aggregation by minute). In order to get a more accurate picture of these metrics, we decided to use Grafana/Influx stack described in my other post to capture second level metrics for WCU/RCU consumption. Our Use case 200 TB dataset stored in Parquet on s3 Ingest into 20 DynamoDB tables using Spark S3 -> Spark -> DynamoDB using AWS labs emr-dynamodb-hadoop connector To ingest a dataset this large in a reasonable amount of time we need to make sure DynamoDB is using all possible capacity across all tables, so good monitoring is critical. The AWS labs Spark connector emr-dynamodb-hadoop has params which let you configure what percentage of your Dynamodb provisioned capacity should be ...