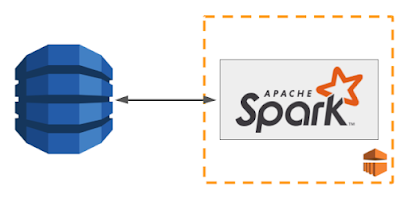
Using Spark to load DynamoDB tables with AWS Spark-Dynamodb connector.
Monitoring DynamoDB Capacity
Getting a true picture of DynamoDB WCU/RCU capacity is difficult because the default monitors automatically aggregate WCU/RCU metrics by minute. This hides spikes and abstracts away true metrics of WCU/RCU consumption (Cloudwatch also does the same aggregation by minute). In order to get a more accurate picture of these metrics, we decided to use Grafana/Influx stack described in my other post to capture second level metrics for WCU/RCU consumption.Our Use case
- 200 TB dataset stored in Parquet on s3
- Ingest into 20 DynamoDB tables using Spark
- S3 -> Spark -> DynamoDB using AWS labs emr-dynamodb-hadoop connector
The AWS labs Spark connector emr-dynamodb-hadoop has params which let you configure what percentage of your Dynamodb provisioned capacity should be consumed by Spark. The connector even allows you to use over 100% of your Dynamodb WCUs by setting to a value over 1.0 (100%).
The frustrating part was even after setting
To get a more accurate monitor I made the following changes to the emr-dynamodb-hadoop connector.
1) Build small wrapper around influxdb. Use the influx-java jar:
<dependency>
<groupId>org.influxdb</groupId>
<artifactId>influxdb-java</artifactId>
<version>2.8</version>
</dependency>
2) Add logging metrics into emr-dynamodb-hadoop
'dynamodb.throughput.write.percent'=1.5 (should allow Spark executors to consume 1.5 times the table WCUs) we still got a WCU graph like below, where consumed WCUs is far below the provisioned WCU limit.Setup
Connect emr-dynamodb-hadoop table in spark job.
Get the Spark jobconf and set the following parameters:
 var ddbConf = JobConf(spark.sparkContext.hadoopConfiguration)
 ddbConf.set("dynamodb.output.tableName", "output_table_name")
 ddbConf.set("dynamodb.throughput.write.percent", "1.5")
 ddbConf.set("mapred.input.format.class", "org.apache.hadoop.dynamodb.read.DynamoDBInputFormat")
 ddbConf.set("mapred.output.format.class", "org.apache.hadoop.dynamodb.write.DynamoDBOutputFormat")
To get a more accurate monitor I made the following changes to the emr-dynamodb-hadoop connector.
1) Build small wrapper around influxdb. Use the influx-java jar:
<dependency>
<groupId>org.influxdb</groupId>
<artifactId>influxdb-java</artifactId>
<version>2.8</version>
</dependency>
2) Add logging metrics into emr-dynamodb-hadoop


Comments
Post a Comment