Installing Influxdb and Grafana on EMR
I wanted to install recent versions of Grafana/InfluxDB stack onto a EMR cluster node for publishing metrics from Spark. This will allow me to receive metrics coming directly from the Spark listeners.
Used Dockerfile here for configs and setup.

Move graphana/config.ini from linked repo to /etc/grafana/config.ini
Add these lines to grafana config file:
Create the following users and databases (while in influx shell):
Influx db API starts on : http://localhost:8086
Grafana default username : admin
Grafana default password : admin
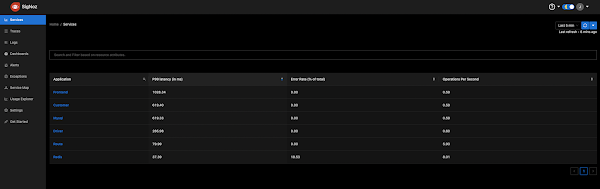
Using Dynamic port forwarding and having foxy proxy enable I can see Grafana here: http://ip-10-244-140-82.us-west-2.compute.internal:3000
Used Dockerfile here for configs and setup.
Find Amazon Linux version
 cat /etc/issue

 Amazon Linux AMI release 2018.03
 cat /etc/system-release

 Amazon Linux AMI release 2018.03
Install Version 5.4.2 of Grafana
sudo yum install https://dl.grafana.com/oss/release/grafana-5.4.2-1.x86_64.rpm
Install Version 1.7.2 on Influx
sudo yum install https://repos.influxdata.com/centos/6/x86_64/stable/influxdb-1.7.2.x86_64.rpm
Configure Grafana/Influx
Move influxdb/config.toml from linked repo to /etc/influxdb/config.tomlMove graphana/config.ini from linked repo to /etc/grafana/config.ini
Add these lines to grafana config file:
 type = influxdb

 host = localhost:8086

 name = grafana

 user = grafana

 password = grafana
Start Influx
/usr/bin/influxd -config=/etc/influxdb/config.toml &
Launch influx shell
/usr/bin/influx
Create the following users and databases (while in influx shell):
 create database data

create database grafana

use data

create user data with password 'data'

use grafana

create user grafana with password 'grafana'
Influx db API starts on : http://localhost:8086
Start Grafana
/usr/sbin/grafana-server --homepath /usr/share/grafana --config /etc/grafana/config.ini
Grafana default username : admin
Grafana default password : admin
Using Dynamic port forwarding and having foxy proxy enable I can see Grafana here: http://ip-10-244-140-82.us-west-2.compute.internal:3000
Command Reference
| Command | Description | Notes |
|---|---|---|
| rpm -ql grafana | Describe rpm install | Used this after I couldnt find how to start grafana-server |
| drop MEASUREMENT dynamodb | Drop measurement in influx | Purge Influx after bad metrics |

Comments
Post a Comment